Operational Delivery: The Second Dimension of Measurement Maturity
Jaiah Kamara, Founder, Signal to Summit | 7 Years Building Measurement at Best Buy Ads | Industry Analyst and Advisor to Retail Media Platform Providers
Part 2 of 3 in the Signal to Summit Measurement Maturity series.
The Signal to Summit Measurement Maturity series introduced three dimensions that determine whether proof reaches the person making the spending decision. Proof capacity was the first: what can you actually demonstrate, and to whom. This paper goes deeper on the second dimension, operational delivery. Because what the first paper made clear is this: proof that cannot get into the right hands, in the right format, at the right moment, does not change a spending decision. Operational delivery is the dimension most retail media organizations underestimate, because the failure is invisible. The work was done. The proof was real. The deal still did not come back.
If you have not read the series introduction, Measurement Maturity: A Framework for Retail and Commerce Media, that is the entry point to the full framework.
If you missed the first dimension, Proof Capacity: The First Dimension of Measurement Maturity is the prerequisite to this paper.
- The Cost of Not Getting Delivery RightFour ways slow proof loses deals brands wanted to give you
- Five Levels of Operational DeliveryFrom Manual and Reactive to Delivery as Competitive Advantage, scored per ad product
- The Portfolio QuestionYour growth formats are the ones still being delivered manually, on the same products that need scale most
- The Benefit of Getting Delivery RightCapacity changes permanently, switching costs accumulate, and you get into models you were never in before
- What Comes NextEcosystem unification determines whether proof and delivery work across your full portfolio or only one ad product at a time
THE COST OF NOT GETTING DELIVERY RIGHT
Delivery failure is not a logistics problem. It is a revenue problem that compounds silently because nobody sees the deals that never materialized. The cost operates at four levels, each escalating in severity.
First, your proof expires before it arrives. Your measurement team produces a credible incrementality analysis for a brand’s Q1 campaign. The problem is the report lands six weeks after the campaign ended. The brand’s media buyer already planned Q2 without it. The agency already reallocated. The insight was real, but it arrived after the decision it was supposed to inform. You did the hardest part, proving the spend worked, and then lost the value by delivering it too late to matter. Every cycle this happens, the brand learns to plan without your data. That behavior becomes permanent.
Second, you lose deals to networks that deliver faster, not better. A brand is evaluating three retail media networks. Your measurement is stronger. Your incrementality methodology is more rigorous. But the other network gives them a self-serve dashboard with daily refresh and API access for their agency. You give them a PDF three weeks after the campaign. Ninety-seven percent of brand advertisers say real-time data access directly influences their investment decisions (NIQ/Coresight, 2024). The brand does not choose the better proof. They choose the proof they can actually use in their workflow. You are not losing on quality. You are losing on access.
Third, your team becomes the bottleneck, and it does not scale. Every custom report, every QBR deck assembly, every request to pull something runs through the same two or three analysts. When your network had 15 advertisers, that worked. Now you have 50, and those analysts are buried. Response times stretch. Errors creep into manually assembled reports. Your best measurement people spend their days formatting spreadsheets instead of driving real value for your clients and your business. You cannot hire your way out of this because the problem is not headcount. It is architecture. Adding analysts to a manual delivery process gives you linear capacity at linear cost. That is a service business, not a scaled media platform.
Put a number on it. A mid-size retail media network runs roughly 50 active campaigns per quarter. At early maturity levels, each campaign report takes approximately four hours of manual assembly: pulling data from a vendor platform, exporting, formatting, delivering. At a monthly reporting cadence, that is 2,400 analyst hours per year on report assembly alone. At $100K per analyst, that is more than a full salary consumed entirely by assembling reports that arrive too late to influence the next spending decision. Now look at what that slow delivery actually costs. If even 10% of those campaigns do not renew because proof arrived after the brand’s planning window closed, and the average campaign is worth $100K to $150K, that is $500K or more per year in revenue that never came back. Not because your proof was wrong. Because it was late. Run the math on your own numbers. The analyst salary is a rounding error compared to the revenue it costs you.
Fourth, the window between successful test and scaled commitment is shorter than most networks realize. When a brand tests a new ad product, there is grace. Everyone knows it is new. Nobody demands API access for a pilot. But the moment that test succeeds and the brand wants to scale it into next year’s plan, delivery expectations shift immediately. If your delivery infrastructure for that format is still in test mode, still manual, still requiring your team to pull and format every report, you cannot meet the standard that scaling requires. The brand wanted to grow with you. Your delivery infrastructure told them you were not ready.
And these costs compound on a rising timeline. Three years ago, a quarterly PDF was acceptable for most brand conversations. Today, agencies expect dashboard access at minimum. By next year, API integration and clean room interoperability will be table stakes for holding company consideration. The networks investing in delivery infrastructure now are building a compounding advantage. Every quarter they operate with faster, more accessible delivery, they accumulate advertiser relationships, agency integrations, and workflow habits that become switching costs. The networks that wait are not standing still. They are falling behind, because the bar is rising whether they keep up or not.
FIVE LEVELS OF OPERATIONAL DELIVERY
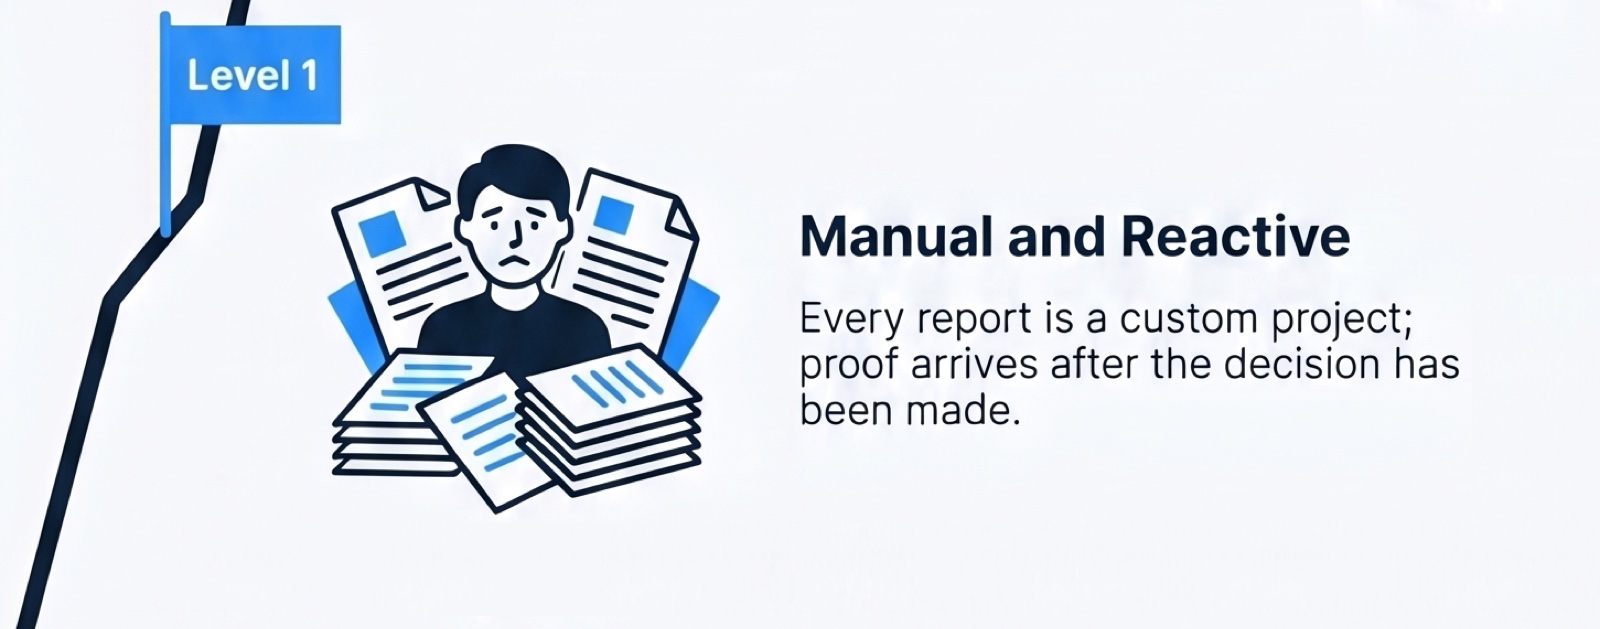
Level 1: Manual and Reactive. Every report is a custom job. A brand emails asking for campaign results. Someone on your team pulls the data, formats a spreadsheet or PDF, and sends it back. There is no standard template, no scheduled delivery, no self-serve access. If the brand wants something, they have to ask for it. If they ask on a Friday, they might get it Tuesday. If the analyst who knows how to pull it is out, it waits.
This is how every network starts, and it works at small scale. Ten advertisers, two analysts, manageable. But delivery at this level is entirely person-dependent. The knowledge of how to pull each format’s data, which vendor login to use, which columns to include, lives in someone’s head. When that person is unavailable, delivery stops. When they leave, institutional knowledge walks out with them.
Why: There is no delivery infrastructure yet, only delivery effort. Each report is produced from scratch because no standardized data pipeline connects your measurement sources to a repeatable output layer. The vendor platforms, the DSP dashboards, the streaming partner portals, each requires a separate login, a separate export, a separate formatting step. The analyst is the integration layer. That is sustainable at pilot scale. It breaks as volume grows.
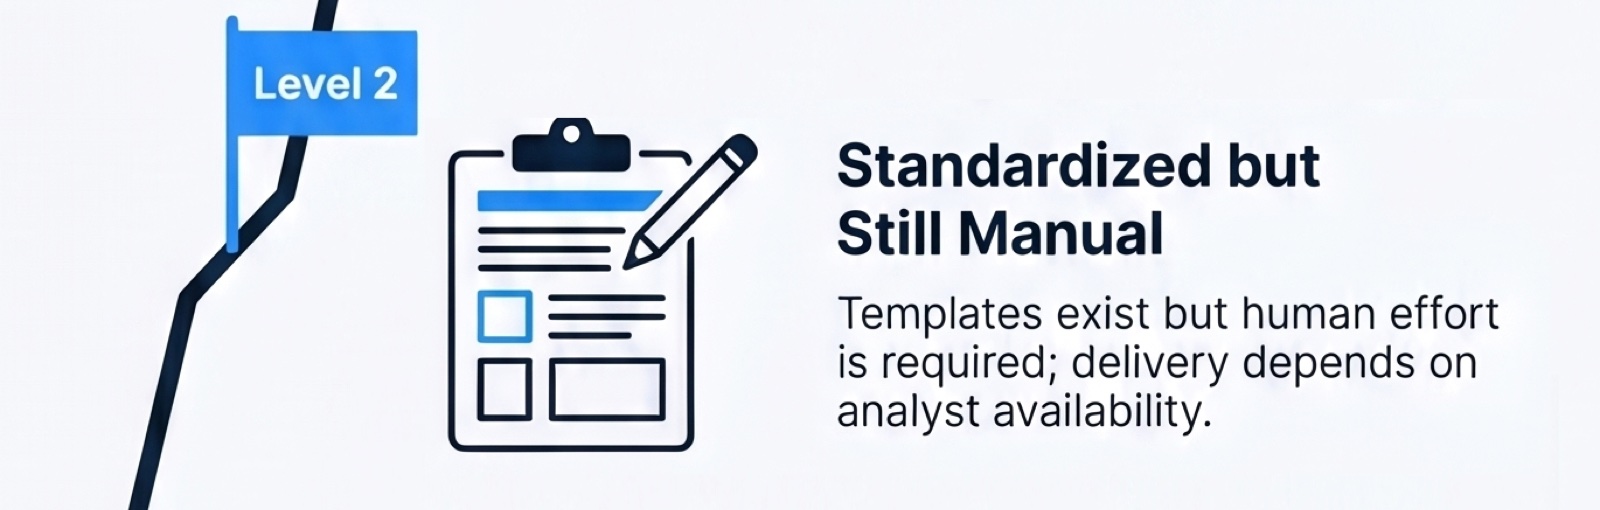
Level 2: Standardized but Still Manual. You built templates. You have a standard campaign report format that most of your team uses most of the time. Delivery is more consistent than Level 1. Brands know roughly what to expect and roughly when to expect it. But everything still runs through your team. Reports go out on a schedule because someone set calendar reminders to pull and send them. QBR decks get assembled by analysts who know the template. If a brand wants something outside the template, it is still a custom request that goes into a queue.
The bottleneck is more visible now. You can see which analysts are overloaded. You can see which advertisers require the most manual effort. You probably have a spreadsheet somewhere tracking report due dates. But the underlying architecture has not changed. Standardization improved consistency. It did not change the fundamental constraint: your team’s bandwidth is the ceiling on how much proof you can deliver.
Why: Standardization is a process improvement, not an infrastructure improvement. You organized the manual work. You made it more consistent. But the data still has to be pulled from each source separately, formatted against a template, and sent through email or a file share. No automated pipeline moves data from source to output. No self-serve layer gives advertisers access without your team in the middle. The template reduced variance in what gets delivered. It did not reduce the labor required to deliver it.
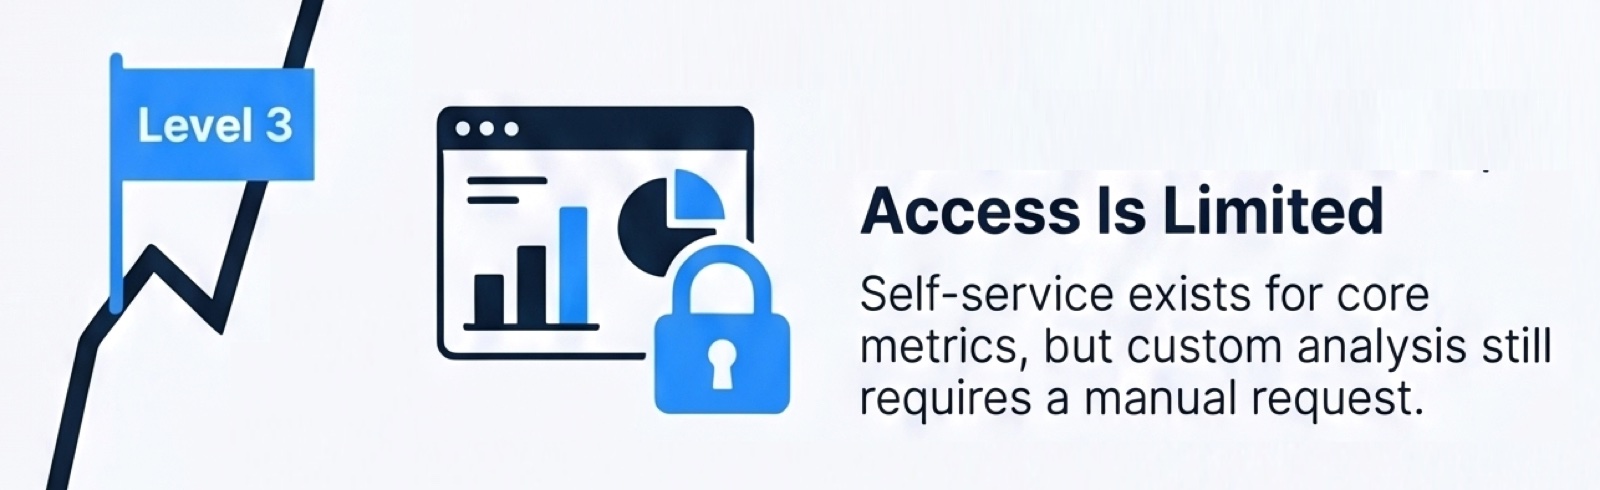
Level 3: Dashboards Are Live, Access Is Limited. You have a reporting dashboard. Brands can log in and see campaign performance without emailing your team. Data refreshes on a regular cadence, daily or weekly depending on the format. For your core ad products, the manual report assembly that defined Levels 1 and 2 is largely gone. Your analysts are no longer spending their days pulling and formatting. They are spending their time on analysis, on answering harder questions, on improving methodology.
But the dashboard serves your needs more than your advertisers’ needs. The metrics it surfaces are the ones your team decided to prioritize. The refresh cadence reflects your data pipeline’s current capability, not the real-time access agencies expect. Brands can see what you built. They cannot customize what they see, pull their own cuts, or connect your data to their own systems. When a holding company media allocator asks for API access so they can normalize your data alongside their other network partners, the answer is not yet. When a brand’s analytics team asks for raw data exports, it is a custom request that still goes through your team.
Why: The dashboard solved the internal bottleneck. It did not solve the external access problem. Building a reporting interface requires choices about what to surface, how to organize it, and what level of access to grant. At Level 3, those choices were made by your team, for your team’s reporting needs. The data model underneath the dashboard was not designed for external consumption. API endpoints do not exist or are not documented for advertiser use. Clean room integration has not been built. The gap between what you can see internally and what an agency can consume programmatically is still wide.
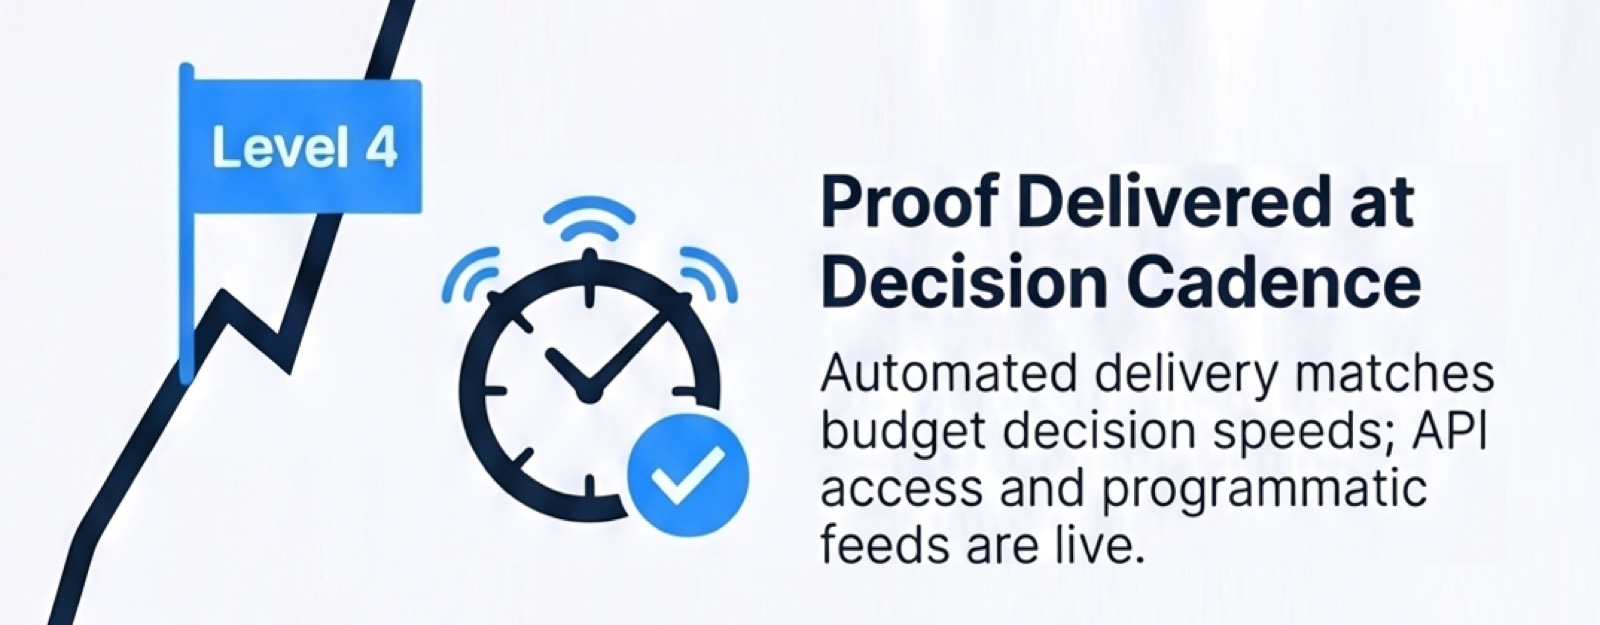
Level 4: Proof Delivered at Decision Cadence. Your delivery infrastructure matches the cadence at which your audiences make decisions. Brand media buyers get daily performance visibility. Agency teams have dashboard access with enough flexibility to pull their own cuts and answer their own questions without routing requests through your team. For your most advanced partners, API access lets them pull your data into their own systems. Clean room collaboration is available for holding company partners who require it.
The manual work that defined earlier levels is now reserved for genuinely complex analysis, not routine reporting. Your analysts spend their time on incrementality studies, on attribution model improvements, on custom measurement questions that require judgment, not on assembling the same campaign summary deck for the fifteenth time. Delivery scales without headcount because the infrastructure carries the routine work.
But the system was built to serve your current advertiser base. New ad products, emerging formats, non-endemic categories, still require manual delivery effort while their measurement pipelines get built. The delivery infrastructure that serves your established formats has not extended fully to your growth formats. The gap between your best and worst delivery capability is widening as you add products faster than you build delivery infrastructure for them.
Why: Level 4 delivery is infrastructure-led for established formats and still person-led for new ones. The data pipelines, API endpoints, and clean room connections that power fast, accessible delivery for sponsored products and onsite display were built over time, with deliberate investment. Those same investments have not yet been made for offsite programmatic, CTV, or in-store. Each new format starts at Level 1 delivery and climbs the maturity curve independently. The network’s overall delivery capability is an average across formats, and that average masks the gaps that matter most to a brand running across your full portfolio.
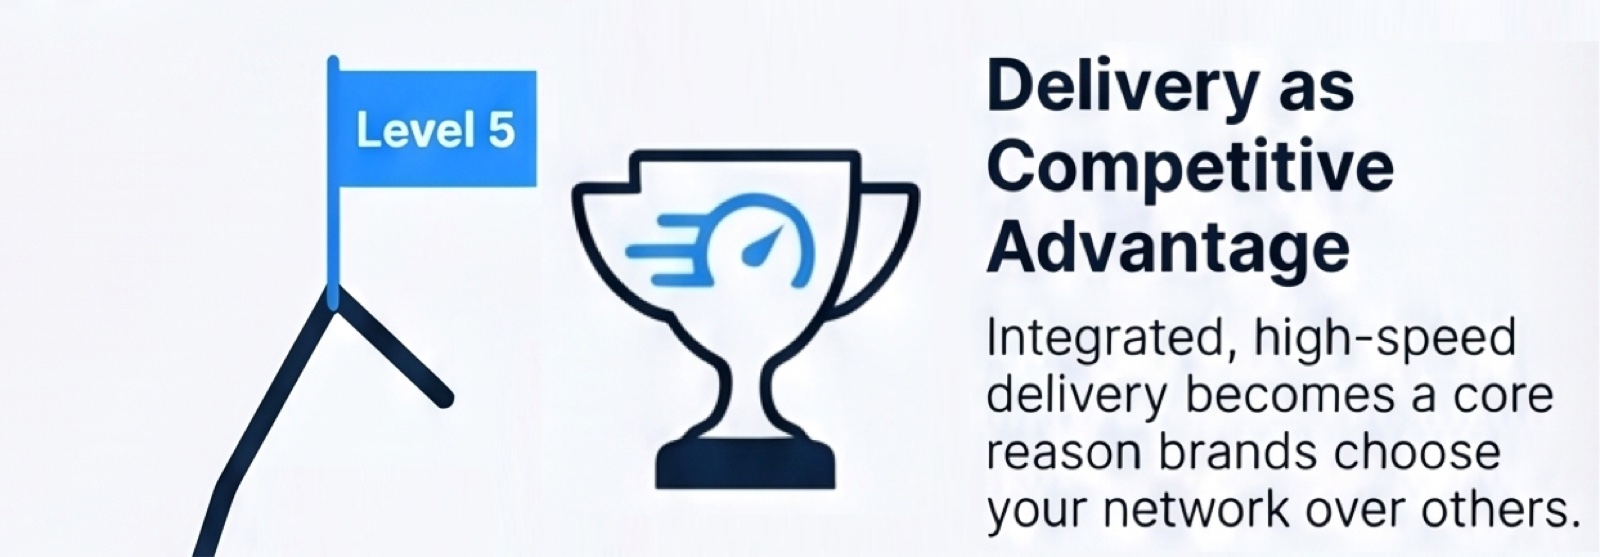
Level 5: Delivery as Competitive Advantage. Your delivery infrastructure is a reason brands choose your network, not just a capability you have to defend. Agencies build workflows around your API because it is reliable, documented, and designed for how they operate. Holding company partners include your network in their automated allocation models because your data is accessible at the cadence and format their systems require. Real-time performance visibility is standard across your full ad product portfolio, not just your legacy formats.
New ad products launch with delivery infrastructure in place, not added later as an afterthought. When a brand tests a new format and wants to scale it, the delivery capability is ready when they are. The test-to-scale transition that stalls growth at lower maturity levels is no longer a constraint.
Your measurement team’s time is spent entirely on advancing methodology, running experimentation programs, and answering strategic questions for your most sophisticated partners. The infrastructure handles the routine. The team handles the complex. That separation is what makes the function scale.
Why: Level 5 delivery is the result of treating delivery architecture as a product, not a process. The data pipelines, API layer, clean room infrastructure, and self-serve access were designed from the beginning to serve external consumption, not just internal reporting. Documentation exists. SLAs exist. Integration support exists. The delivery system was built for your audiences’ workflows, not your team’s workflows.
The competitive moat at this level is not the technology itself. Any network can buy the same infrastructure components. The moat is the accumulated workflow integrations, the agency relationships built around your API, and the advertiser habits formed around your delivery cadence. Those do not replicate quickly. Every quarter you operate at Level 5 delivery while competitors operate at Level 3, the switching cost for your advertisers increases. Delivery infrastructure, when it reaches this level, stops being a measurement function and becomes a retention and acquisition asset.
THE PORTFOLIO QUESTION
The same unevenness that defines proof capacity shows up in delivery, and it shows up in the same place: your growth formats.
Your established ad products, the ones generating the most revenue today, have the strongest delivery infrastructure. They were built first. The data pipelines are clean. The dashboards are live. The API access exists. Your emerging formats, the ones you are counting on to grow the business, are the ones still being delivered manually. CTV measurement goes out as a post-campaign PDF. In-store performance requires a custom pull. Non-endemic proof paths have no delivery infrastructure at all because the proof methodology was just built.
The pattern compounds the proof capacity problem from Paper 1. Your growth formats have the weakest proof and the slowest delivery. The ad products you need to scale are the least equipped to earn the investment they need to get there, on two dimensions simultaneously.
And here is the portfolio question specific to delivery: which of your advertisers are making allocation decisions right now that your delivery infrastructure cannot inform? A brand running across four of your ad products needs cross-format performance data at the cadence their media buyer plans. If two of those four formats are still on manual delivery, the cross-format story you need to tell is incomplete, and the brand fills the gap with their own assumptions. Those assumptions rarely favor your network.
THE BENEFIT OF GETTING DELIVERY RIGHT
Getting delivery right has three hard consequences that go beyond operational efficiency.
First, your team’s capacity changes permanently. When delivery infrastructure carries the routine work, your analysts stop being report assemblers and start being measurement strategists. The incrementality studies that never got prioritized because the team was buried in PDF assembly now get done. The attribution model improvements that were always on the roadmap get built. The custom measurement questions your most sophisticated partners bring you get answered faster. The function that felt like a cost center starts producing the insights that drive renewal conversations.
Second, your advertiser relationships develop switching costs they did not have before. When a brand’s analytics team builds their workflow around your API, when a holding company’s allocation model pulls your data automatically, when an agency’s media mix model includes your network as a standard input, the cost of removing your network from their plan is no longer just a performance question. It is an integration question. Disconnecting from your delivery infrastructure requires rebuilding workflows they have come to depend on. That is a structural retention advantage that no proof improvement alone can create.
Third, you get into models you were never in before. Holding company allocation models do not manually evaluate every network for every client. They pull from the networks whose data is accessible at the cadence and format their systems require. If your data is not in the model, you are not in the consideration set, regardless of how strong your proof is. Level 5 delivery is the entry requirement for the allocation decisions where the largest budgets get moved. Proof capacity earns you the right to be evaluated. Delivery infrastructure determines whether you are actually in the room when the decision gets made.
That is the operational delivery dimension. Where you sit on that spectrum determines whether the proof your measurement team produces actually reaches the person making the spending decision, in the format they need, at the moment their decision requires it.
WHAT COMES NEXT
But there is a third dimension that determines whether both proof and delivery can function across your full channel portfolio, or only work for the ad products you built first.
Your sponsored products might have strong proof and fast delivery. Your offsite display might be close behind. But if those systems are reporting through separate pipelines with separate identity backbones and separate methodologies, a brand running across both formats cannot get a coherent answer to the most basic portfolio question: did these formats work together, or did they work against each other?
Proof and delivery that function within each ad product but cannot connect across them leave your biggest advertisers with a fragmented picture of your network’s value. The brands spending the most across your portfolio are the most exposed to that fragmentation. And the cost is not just a reporting inconvenience. It is a structural limit on the revenue story you can tell.
That is what comes next: Ecosystem Unification: The Third Dimension of Measurement Maturity. How connected are the systems producing your proof, and what does it cost when the answer is not connected enough?
If you have not read the prior installments, the series overview and Proof Capacity are the entry points.
Why I Do This Work
I’m Jaiah Kamara, founder of Signal to Summit.
I spent fifteen years in retail, seven of those years in central leadership roles building the reporting and measurement infrastructure at a top-ten retail media network. I built systems that drove advertiser confidence: reliable reporting infrastructure, decision frameworks that empowered action, operating models that ensured data quality, and cross-functional ways of working that aligned sales, strategy, and measurement around shared truth.
I now work as an industry analyst and advisor helping retail and commerce media platform providers and operators move this industry forward. I commission structured research that fills the gaps published frameworks miss, and I publish what I find so the industry can move together.
The Signal to Summit Difference
Most of my work in retail media was not about strategy decks. It was about building systems that drove advertiser confidence and organizational readiness. The Signal to Summit Measurement Maturity Framework is one of those systems, made portable for the industry. The operational delivery dimension you just walked through is one piece of it.
If you are a retail or commerce media operator, platform provider, or holding company partner, and any of what you read above lands on something you are navigating right now, the path to talking is short.
Keep Reading

June 1, 2026
Ecosystem Unification: The Third Dimension of Measurement Maturity
Defined by whether your measurement holds together across the whole portfolio, or only works one channel at a time.

April 21, 2026
Proof Capacity: The First Dimension of Measurement Maturity
Defined by what your measurement can demonstrate, and to whom.
April 14, 2026
Measurement Maturity: A Framework for Retail and Commerce Media
Defined by what you can prove, deliver, and unify.